As a historian with an emphasis on digital humanities, I have created data visualizations for different projects with a variety of tools. I have used both lightweight, online tools as well as computational and visualization software languages.
ArcGIS StoryMaps
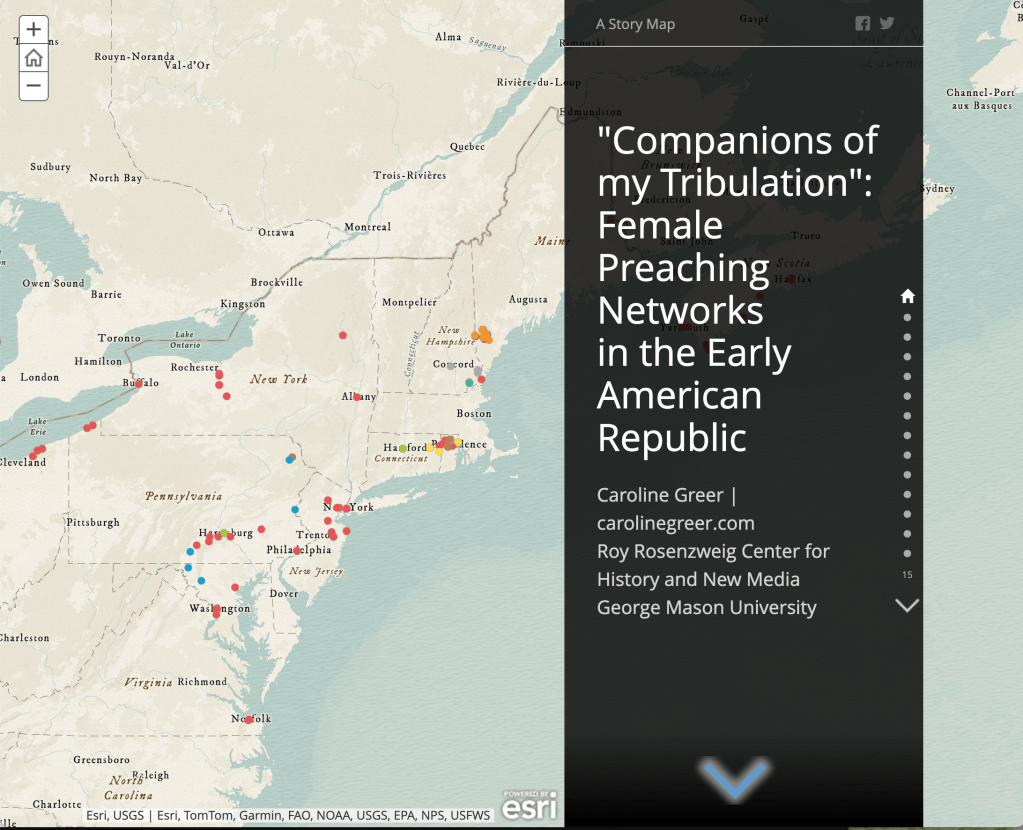
My first foray into visualizations was a StoryMaps Map Journal tracing the journey of a female preacher, Nancy Towle, as she itinerated around the Eastern part of the United States, Canada, United Kingdom, and Ireland in the 1820s and 1830s. ArcGIS StoryMaps is very user- and beginner-friendly. This map focuses on Towle’s work and travel with other female preachers. I included maps from this in my master’s thesis, though the project has been updated and presented on in the last few years.
GeoJSON

While I acted as a GRA and project manager of the American Religious Ecologies project, I focused on female pastors and leadership that could be found in the schedule. As a case study, I mapped the congregations of the National Spiritual Alliance in 1926. Spiritualism has a history of female leadership — both as mediums and as pastors. By mapping the congregations and tallying the gender of pastors, I argue that the NSA managed to keep a large proportion of female leadership in their denomination after formalization, unlike Protestant denominations that decreased the amount of women ministers as they gained formal recognition.
